 Drug discovery is a costly and lengthy process, filled with lots of false leads and unsuccessful efforts. The pharmaceutical industry is one of the most heavily regulated industries in the world with many rules and regulations enforced by the government to protect the health and well-being of the public. The probability of a drug passing a clinical trial phase is less than 12%, most drugs failing due to safety reasons [1]. In the United States, it takes an average of 10–12 years for an experimental drug to transition from theory to practice, clinical trials account for approximately 6 years of this timeframe. The average cost to research and develop each successful drug is estimated to be $2.6 billion. This number incorporates the cost of failures — of the thousands and sometimes millions of compounds that may be screened and assessed in the early stages of R&D, only a few of which will ultimate receive approval [1]. Therefore, there is a large scope for improvement when it comes to streamlining the drug development pipeline and especially each step taken before a drug is introduced into a clinical trial.
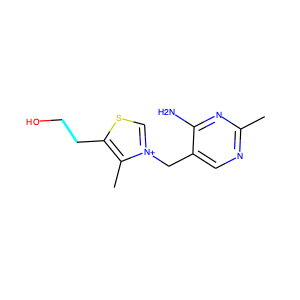
Fortunately, pharmaceutical and biotech industries work with enormous amount of data, but only a tiny fraction of that data is actually processed to provide any tangible results. Therefore, there are opportunities to apply machine learning approaches in all stages of drug discovery, from drug target validation, bioactivity prediction, identifying prognostic biomarkers, etc. [2]. But before we can apply machine learning to molecules we need a way to represent them in a form accessible for machines to understand and work with. Usually when we think about molecules we imagine groups of atoms connected to each other using chemical bonds. In order for machines to work with molecular data, it is important to represent them in the form of line notation. Such a system is called simplified molecular-input line-entry system (SMILES). The original SMILES specification was initiated in 1980s and it is really useful in describing the structure of chemical species using short ASCII strings [3]. For example the string “OCCc1c(C)n+Cc2cnc(C)nc2N” represents the important nutrient Thiamine also known as Vitamin B1 [4]. Most chemical database utilize SMILES string notation for drugs.
We don’t need to memorise these notations as most modern molecule editors can automatically convert SMILES strings into 2D or 3D models of molecules. It can be easily converted in python using the most important open-source cheminformatics and machine learning toolkit called RDKit [5]. The vast majority of the basic molecular functionality is found in the module rdkit.Chem. Following code shows how to turn thiamine SMILES string into 2D molecular representation.
from rdkit import Chem
from rdkit.Chem import Draw
from IPython.display import SVG

# describes the important nutrient thiamine also known as vit B1
smiles = 'OCCc1c(C)[n+](CS1)Cc2cnc(C)nc2N'
Draw.MolToImage(Chem.MolFromSmiles(smiles))
Even though SMILES strings allow us to think of molecules in terms of sequence of string, it is still not in the right format for many machines learning models. This is because molecules usually come with different number of atoms and have different sequence length. Lots of ML models require inputs to be of the same length. In order to solve that problem we have to featurize the SMILES strings by turning them into a vector of fixed length [4]. There are many ways to do that, but for this blog post we will focus on two approaches and even carry out a ML prediction on the two approaches to see how they perform. We will work with the biophysical HIV dataset from http://moleculenet.ai/datasets-1. MoleculeNet curates multiple public datasets, and establishes metrics for evaluation, and offers high quality open-source implementations of multiple previously proposed molecular featurization and learning algorithms.
Extended connectivity Fingerprints:
I won’t be going into too much details on ECFP as there is an excellent blog post that describes what different kinds of molecular fingerprinting are, please check [6] for more details. Basically, extended connectivity fingerprints (ECFP) are vectors of 1s and 0s that represent the presence or absence of specific features in a molecule. They extract features of molecules, hash them and use the hash to determine bits that should be set as vectors [7]. This helps to combine several useful features of molecules, and take molecules of an arbitrary size and convert them into fixed length vectors [4] ready for use in ML models.

They make it easy to compare different models as we can simply take the fingerprints for two molecules and compare the corresponding elements. The more elements that match, the more similar the molecules are. The only disadvantage of ECFP, is that fingerprint encodes a large amount of information about the molecule, but some information does get lost. It is possible for two different molecules to have identical fingerprints and given a fingerprint, it is impossible to uniquely determine what molecules it came from [4].
We can take a look at how fingerprinting works by applying it on a dataset from MoleculeNet.ai. You can download the dataset from the following link HIV. Once we unzip the file we can take a look at what the file contains.
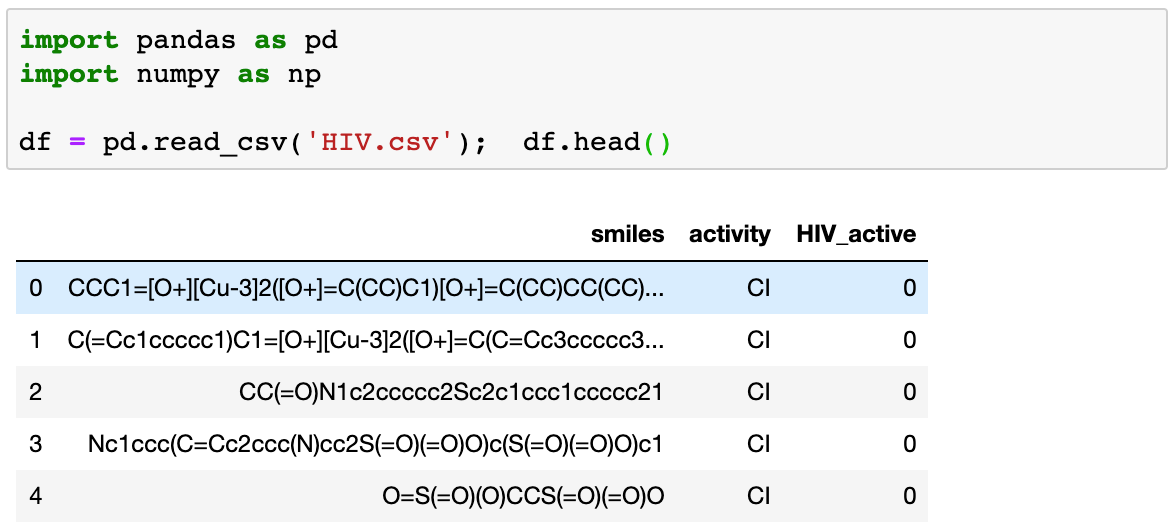
The HIV dataset was introduced by the Drug Therapeutics Program (DTP) AIDS Antiviral Screen, which tested the ability to inhibit HIV replication for over 40,000 compounds. Screening results were evaluated and placed into three categories: confirmed inactive (CI),confirmed active (CA) and confirmed moderately active (CM). They also provide another column with binary labels for screening results: 1 (indicating CA/CM) and 0 (CI).
We will now see what happens to these SMILES string once we perform an ECFP. We will require a new library to do that, it’s called deepchem, you can learn more about them here https://deepchem.io/. It is a very useful package when we want to work with chemical datasets, it works on top of RDKit toolkit. We can featurize the SMILES column in our dataset as follows. We can see that we end up with a dataframe containing 1025 columns. This is because while instantiating the featurizer module we set the size to 1024.
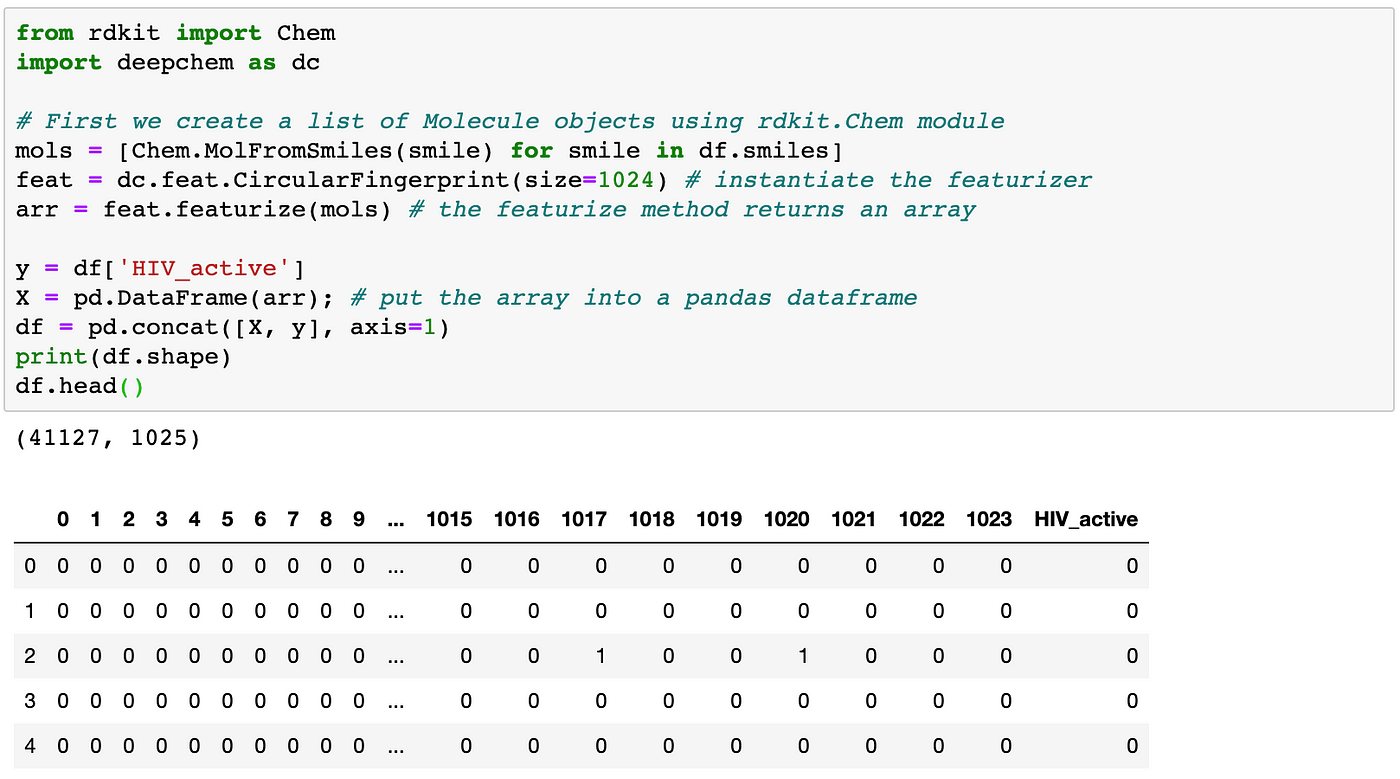
During the featurization process the molecules are decomposed into smaller circular substructures. The substructure contains a central atom and its neighbours grouped by distance to the centre [8]. After hashing all the substructures we end up with a fixed length binary fingerprint. It is thought that this binary representation contains information about topological characteristics of the molecule, which enables it to be applied to tasks such as similarity searching and activity prediction [9].
When we look at the latest result of test performed on this dataset, we find that Xgboost performs best, with a roc/auc score of 0.841 [http://moleculenet.ai/latest-results]. In this blog post, we will carry out a basic lightGBM model on our featured dataset to check how well it performs in comparison to Xgboost. We can implement it as follows:
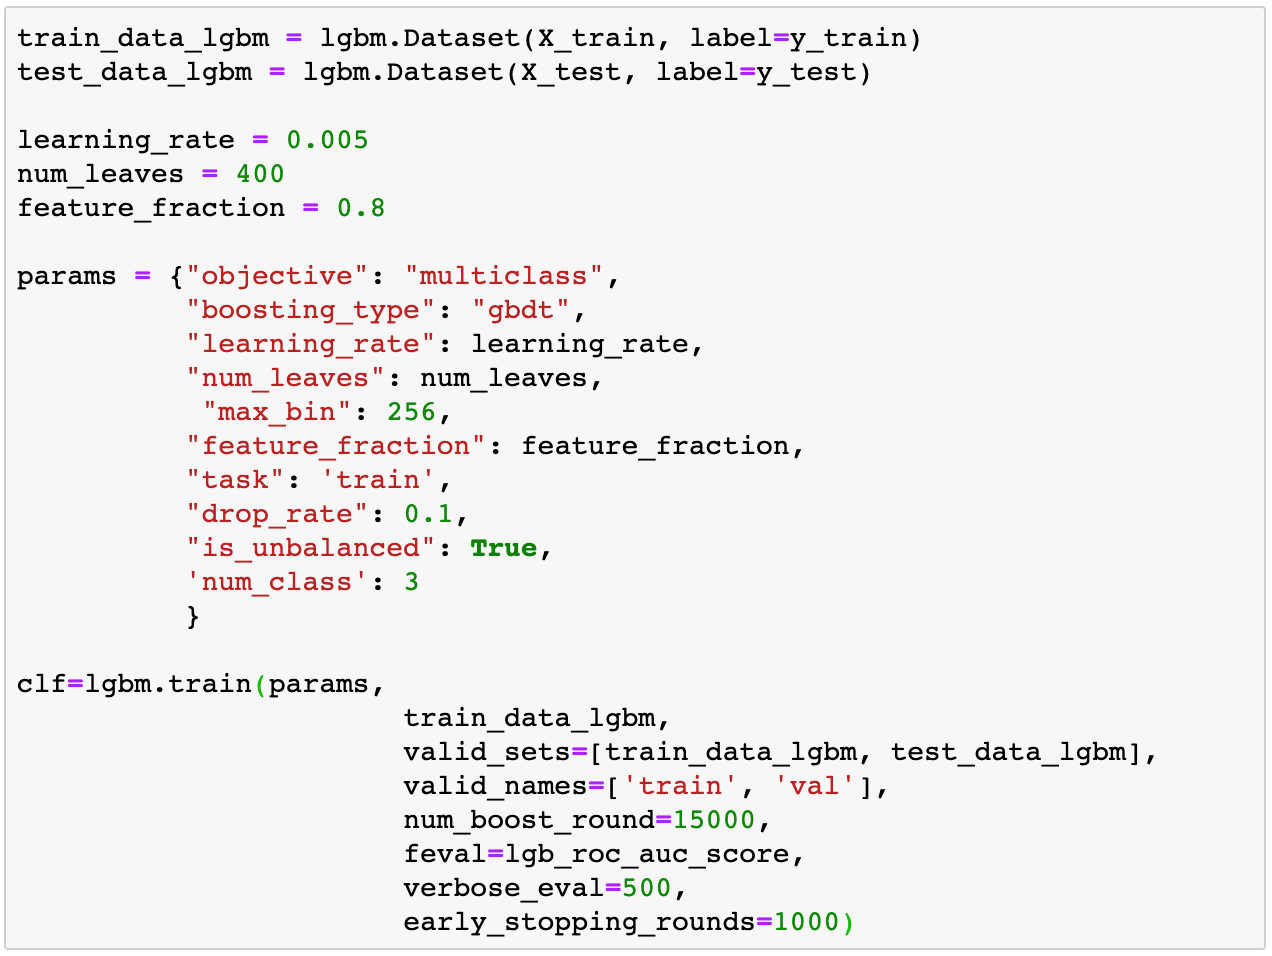
When we look at the roc_auc_score of the final iteration, we find a score of 0.73. For just a basic version without carrying out scaffold splitting, I think the model is doing good job.

For the final part of the blogpost we can just take a look at another method of featurizing which can be used with most graph based models. We will implement the whole code in deepchem and see how easy it is to build a simple DL model in deepchem.
Graph Convolutions:
Even though ECFP does a good job as featurizing molecular data, it has severe drawbacks in being able to identify cyclic structures in a compound. This is because essentially molecules are graphs, where each atom can be thought of as node and the bonds between them can represent edges. Many problems with real importance usually come in the form of graphs, like social network, knowledge graph, protein interaction networks. However, until recently very little attention was placed in trying to restructure the neural network architecture to work with structured graphs. This has resulted in creation of some really powerful graph convolution networks, which can easily represent the nearness of nodes in their 2-d representation. If you want to learn more about graph convolution networks you can take a look at the following two blog post [12, 13].
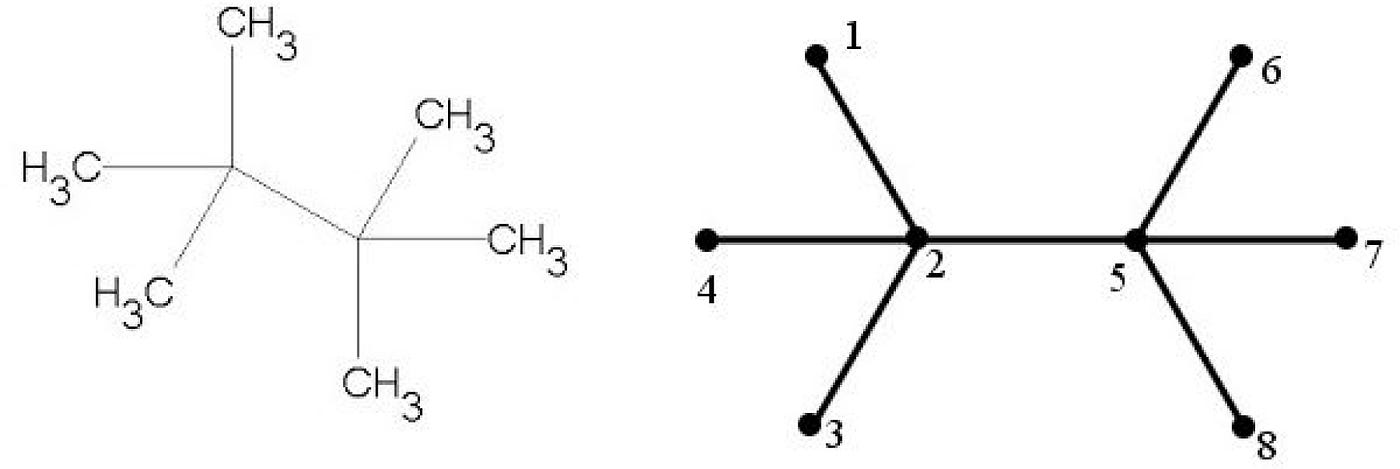
The graph convolutions featurization computes an initial feature vector and a neighbour list for each atom. This feature vector summaries the atom’s local environment, in the form of lists containing neighbouring atom-types, hybridisation types and valence structures. This list represents connectivity of the whole molecule, which can be processed by graph based models to general graph structures. Deepchem package comes with a handy module to load MoleculeNet dataset, and while loading the dataset, we can specify what kind of featurization we would like to be performed on the dataset. We can implement the whole loading and modelling in just a few lines of code [4].


When we compute the final metrics we see that our model is overfitting to the training dataset and has a roc/auc score of 0.74 on the test dataset. There is still room for improvement. The official benchmark for the use of GraphConv on this dataset is and roc/auc score 0.79. Our score is not too bad considering this is just an out of box implementation of the GraphConv model from the deep chem library. If we really want to we can change some of the parameters to ensure that we reach the benchmark performance.
References:
-
http://phrma-docs.phrma.org/sites/default/files/pdf/rd_brochure_022307.pdf
-
Vamathevan, J., Clark, D., Czodrowski, P. et al. Applications of machine learning in drug discovery and development. Nat Rev Drug Discov 18, 463–477 (2019) doi:10.1038/s41573–019–0024
-
https://en.wikipedia.org/wiki/Simplified_molecular-input_line-entry_system
-
Ramsundar B, et. al (2019) Deep learning for life sciences, O′Reilly (12 April 2019)
7.https://www.rdkit.org/UGM/2012/Landrum_RDKit_UGM.Fingerprints.Final.pptx.pdf
9.https://pubs.rsc.org/en/content/articlelanding/2018/sc/c7sc02664a#!divAbstract
-
Hosamani, Sunilkumar. (2016). Correlation of domination parameters with physicochemical properties of octane isomers. Applied Mathematics and Nonlinear Sciences. 1. 345–352. 10.21042/AMNS.2016.2.00029.
-
Kipf, Thomas & Welling, Max. (2016). Semi-Supervised Classification with Graph Convolutional Networks.